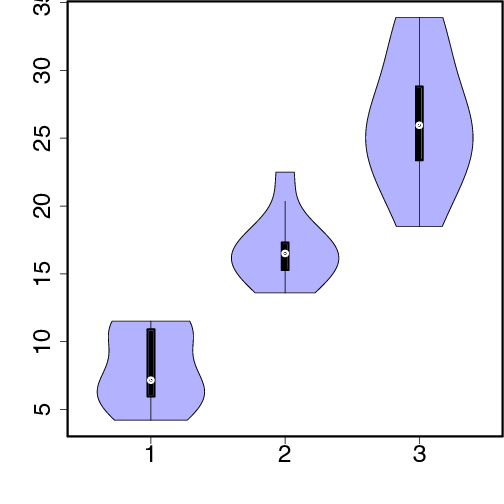
library(vioplot)
dose.5 <- teeth$len[teeth$dose==0.5]
dose1 <- teeth$len[teeth$dose==1.0]
dose2 <- teeth$len[teeth$dose==2.0]
vioplot(dose.5, dose1, dose2, col=myblue)