R code used to produce the graph shown below.
# Set extra space for rotated labels
par(mar = c(7, 4.2, 1, 1) + 0.1)
# Create plot with no x axis and no x axis label
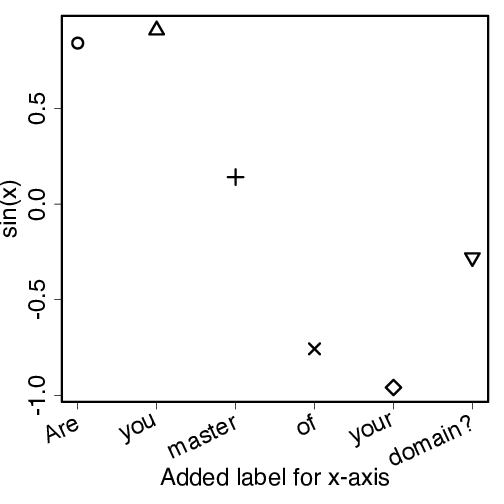
x <- 1:6
plot(x, sin(x), xaxt="n", xlab="", pch=1:6, cex=mycex)
axis(1, labels=FALSE)
labels <- c("Are", "you", "master", "of", "your", "domain?")
# Add labels at default tick marks
text(x, y=par("usr")[3] - .1, srt=25, adj=1,
labels=labels, xpd=TRUE, cex=2)
# Add axis label at line 5
mtext(1, text="Added label for x-axis", line=5, cex=2)