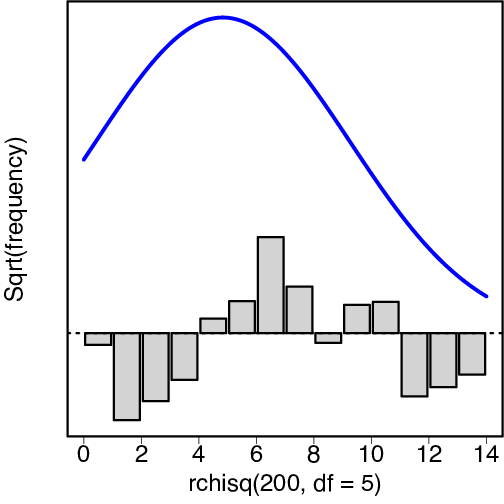
R code used to produce the graph shown below.
library(MESS)
rootonorm(rchisq(200, df=5), type="deviation", breaks=15, linecol=fgblue, lwd=5)