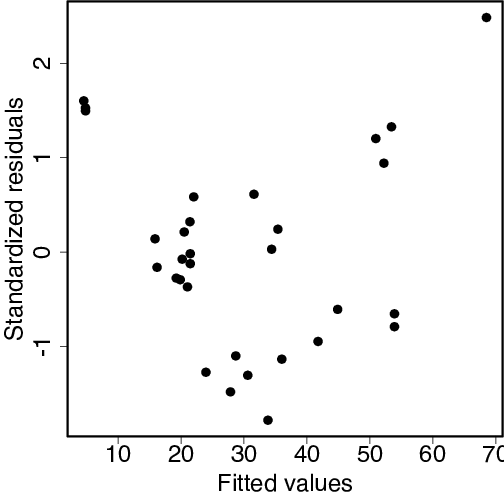
plot(fitted(result), rstandard(result),
     xlab="Fitted values", ylab="Standardized residuals", cex=mycex)
plot(trees$Height, rstandard(result),
     xlab="Height", ylab="Standardized residuals", cex=mycex)