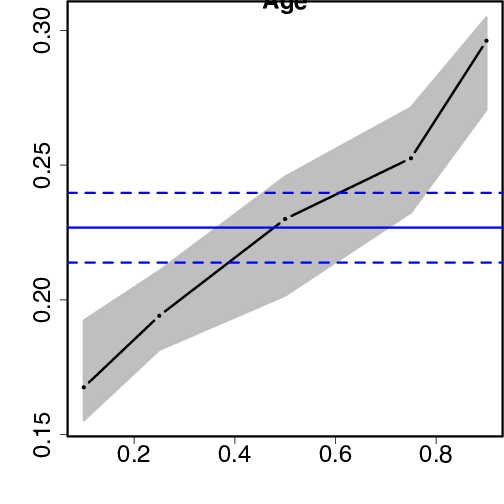
R code used to produce the graph shown below.
myplot(summary(res), lcol="blue", level=0.95)