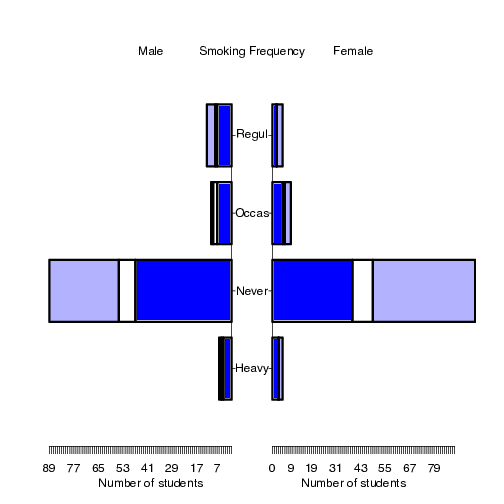
pyramid.plot(lx=result$Male, rx=result$Female,
             labels=row.names(result$Male),
             gap=10, unit="Number of students",
             top.labels=c("Male","Smoking Frequency","Female"),
             lxcol=c(fgblue, "white", myblue),
             rxcol=c(fgblue, "white", myblue))