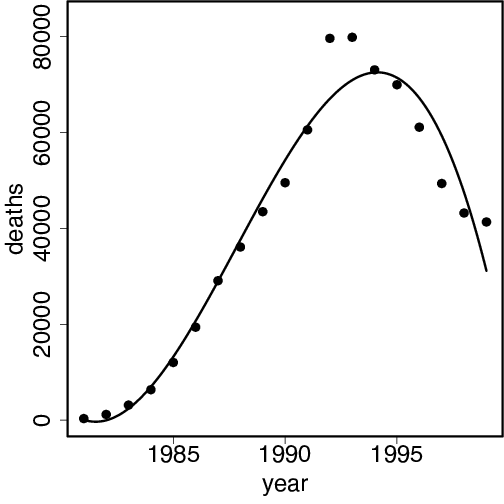
# Plot the data and add the fitted cubic line
plot(year, deaths, cex=mycex, ylim=c(0, 84000))
lines(seq(1981, 1999, .1),
      predict(model, data.frame(newyear=seq(1, 19, .1))))