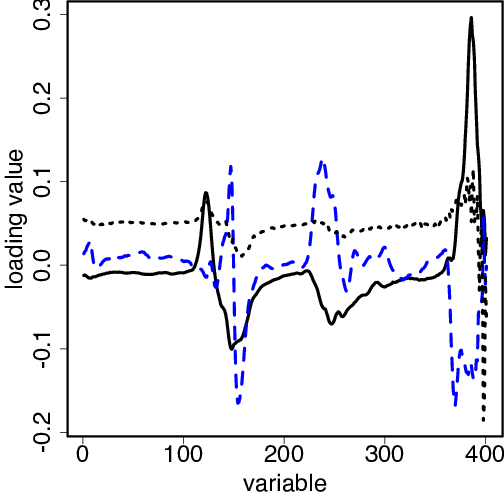
plot(gas1, ncomp=3, line=TRUE, cex=mycex, main="")
plot(gas1, "loadings", comps=1:3, col=c("black", "blue", "black"), lwd=4)