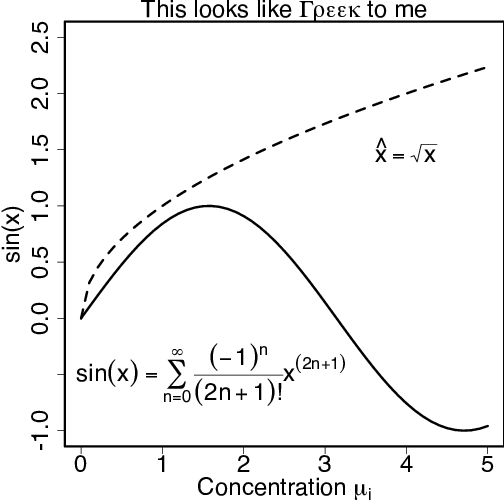
R code used to produce the graph shown below.
par(mar=c(4,4.5,1.5,0))
x <- seq(0, 5, .1)
# Plot sine and square root curve and add x axis label
plot(x, sin(x), type="l", ylim=c(-1, 2.5),
     xlab=expression(paste("Concentration ", mu[i])))
lines(x, sqrt(x), lty=2)
title(expression(paste("This looks like ", Gamma,
      rho, epsilon, epsilon, kappa, " to me")))
# Place equations at specific positions
text(4, 1.5, expression(hat(x) == sqrt(x)), cex=mycex)
text(1.6, -.5, expression(paste(plain(sin)(x) ==
     sum(frac((-1)^n, paste((2*n+1), plain("!")))*x^(2*n+1),
     n==0, infinity))), cex=mycex)