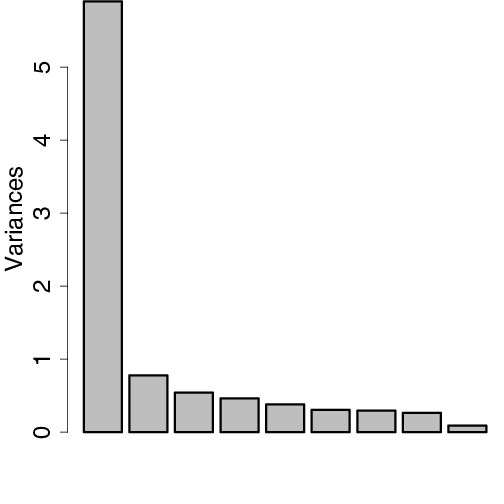
R code used to produce the graph shown below.
plot(fit, main="")


biplot2 <- function (x, choices = 1L:2L, scale = 1, pc.biplot = FALSE, ...)
    {
        if (length(choices) != 2L)
            stop("length of choices must be 2")
        if (!length(scores <- x$x))
            stop(gettextf("object '%s' has no scores", deparse(substitute(x))),
                 domain = NA)
        if (is.complex(scores))
            stop("biplots are not defined for complex PCA")
        lam <- x$sdev[choices]
        n <- NROW(scores)
        lam <- lam * sqrt(n)
        if (scale < 0 || scale > 1)
            warning("'scale' is outside [0, 1]")
        if (scale != 0)
            lam <- lam^scale
        else lam <- 1
        if (pc.biplot)
            lam <- lam/sqrt(n)
        biplot.default2(t(t(scores[, choices])/lam), t(t(x$rotation[,
                                                                   choices]) * lam), ...)
        invisible()
        }

biplot.default2 <- function(x, y, var.axes = TRUE, col, cex = rep(par("cex"), 2),
          xlabs = NULL, ylabs = NULL, expand = 1, xlim = NULL, ylim = NULL,
          arrow.len = 0.1, main = NULL, sub = NULL, xlab = NULL, ylab = NULL,
          ...)
    {
        n <- nrow(x)
        p <- nrow(y)
        if (missing(xlabs)) {
            xlabs <- dimnames(x)[[1L]]
            if (is.null(xlabs))
                xlabs <- 1L:n
        }
        xlabs <- as.character(xlabs)
        dimnames(x) <- list(xlabs, dimnames(x)[[2L]])
        if (missing(ylabs)) {
            ylabs <- dimnames(y)[[1L]]
            if (is.null(ylabs))
                ylabs <- paste("Var", 1L:p)
        }
        ylabs <- as.character(ylabs)
        dimnames(y) <- list(ylabs, dimnames(y)[[2L]])
        if (length(cex) == 1L)
            cex <- c(cex, cex)
        if (missing(col)) {
            col <- par("col")
            if (!is.numeric(col))
                col <- match(col, palette(), nomatch = 1L)
            col <- c(col, col + 1L)
        }
        else if (length(col) == 1L)
            col <- c(col, col)
        unsigned.range <- function(x) c(-abs(min(x, na.rm = TRUE)),
                                        abs(max(x, na.rm = TRUE)))
        rangx1 <- unsigned.range(x[, 1L])
        rangx2 <- unsigned.range(x[, 2L])
        rangy1 <- unsigned.range(y[, 1L])
        rangy2 <- unsigned.range(y[, 2L])
        if (missing(xlim) && missing(ylim))
            xlim <- ylim <- rangx1 <- rangx2 <- range(rangx1, rangx2)
        else if (missing(xlim))
            xlim <- rangx1
        else if (missing(ylim))
            ylim <- rangx2
        ratio <- max(rangy1/rangx1, rangy2/rangx2)/expand
        on.exit(par(op))
        op <- par(pty = "s")
        if (!is.null(main))
            op <- c(op, par(mar = par("mar") + c(0, 0, 1, 0)))
        plot(x, type = "n", xlim = xlim, ylim = ylim, col = col[1L],
             xlab = xlab, ylab = ylab, sub = sub, main = main, ...)
        text(x, xlabs, cex = cex[1L], col = col[1L], ...)
        par(new = TRUE)
        dev.hold()
        on.exit(dev.flush(), add = TRUE)
        plot(y, axes = FALSE, type = "n", xlim = xlim * ratio, ylim = ylim *
                 ratio, xlab = "", ylab = "", col = col[1L], ...)
        axis(3, col = col[2L], ...)
        axis(4, col = col[2L], ...)
        box(col = col[1L])
        text(y, labels = ylabs, cex = cex[2L], col = col[2L], ...)
        if (var.axes)
            arrows(0, 0, y[, 1L] * 0.8, y[, 2L] * 0.8, col = col[2L],
                   length = arrow.len, ...)
        invisible()
        }
biplot2(fit, cex=mycex, col=c("gray", "blue"), lwd=5)