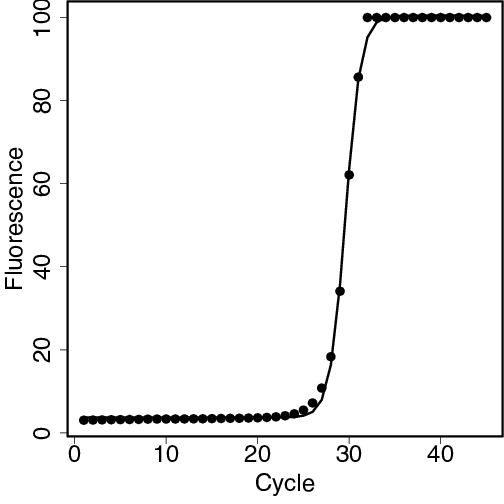
plot(run1$cycle, run1$flour,
     xlab="Cycle", ylab="Fluorescence", cex=mycex)
lines(run1$cycle, predict(model)) # Add the fitted line