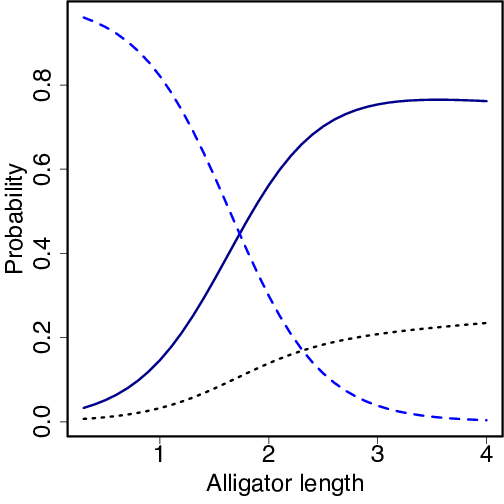
len <- seq(0.3, 4, .1)
matplot(len, predict(model, newdata=data.frame(length=len),
                     type="probs"), type="l", cex=mycex, lwd=3, col=c("darkblue", "blue", "black"),
             xlab="Alligator length", ylab="Probability")