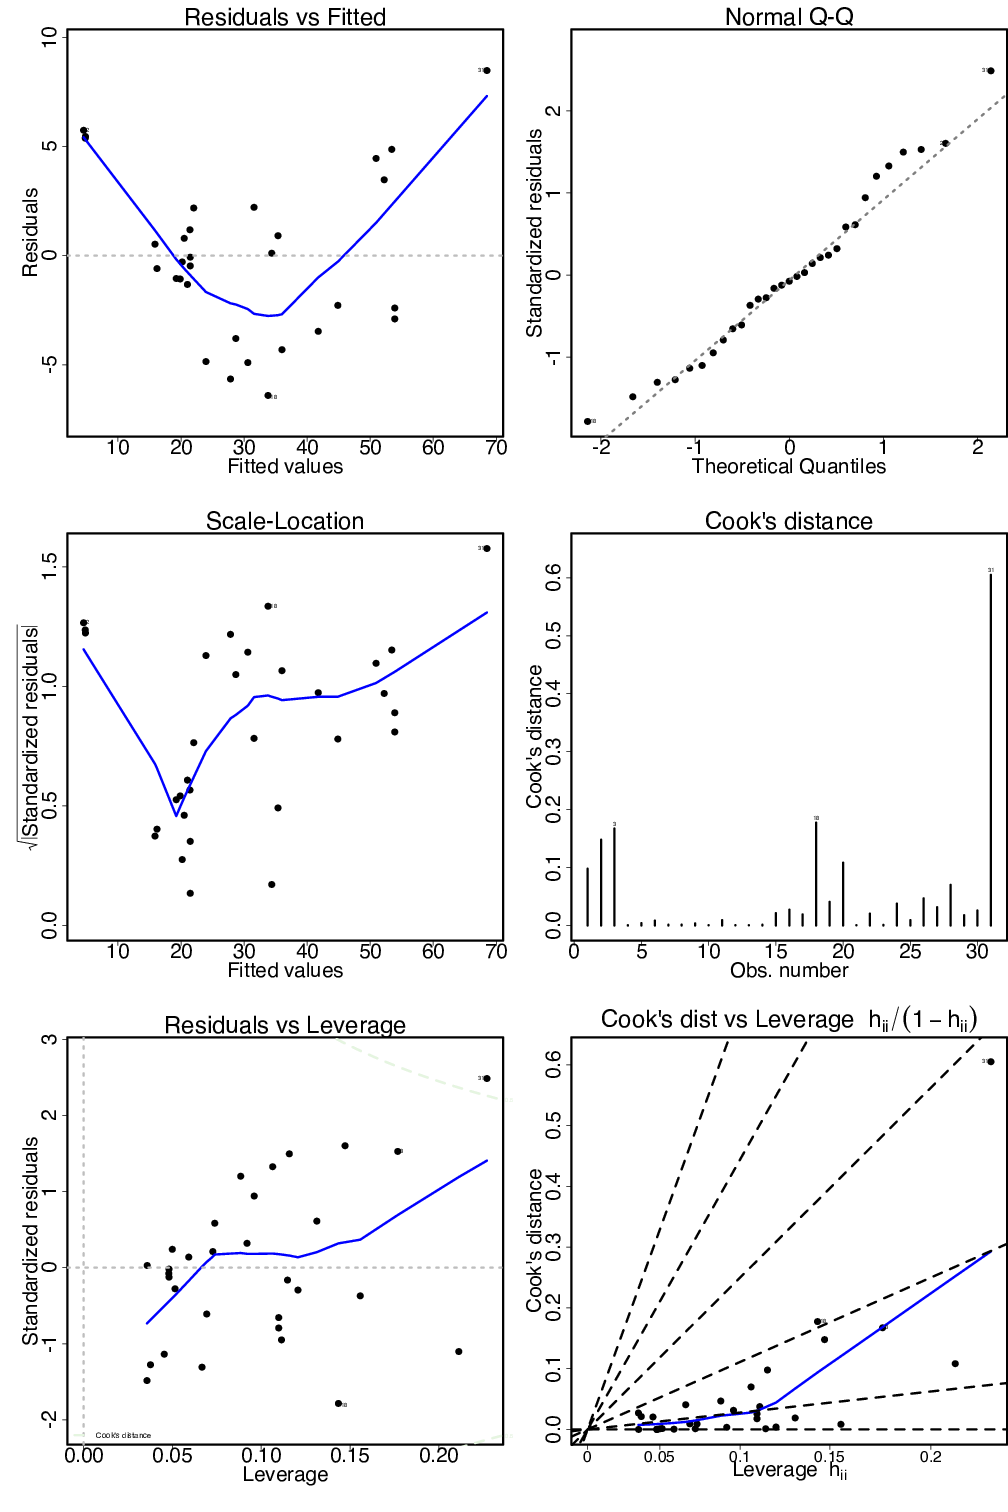
data(trees)
result <- lm(Volume ~ Height + Girth, data=trees)
oldpar <- par()
par(mfrow=c(3,2), mar=c(7, 7, 3, 0)+.1)
plot(result, which=1:6, cex=2, col.smooth="blue", cex.axis=2.6, cex.lab=2.6, cex.caption=2)
par(mfrow=c(1,1))
par(oldpar)