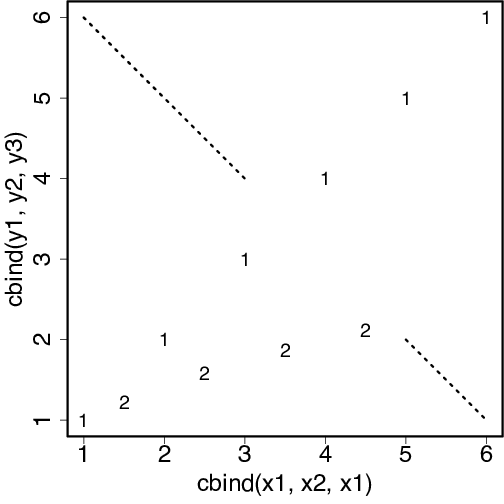
x1 <- 1:6
y1 <- x1
x2 <- c(1.5, 2.5, 3.5, 4.5, NA, NA)
y2 <- sqrt(x2)
y3 <- 7-x1
y3[4] <- NA
matplot(cbind(x1, x2, x1), cbind(y1, y2, y3), type=c("p", "p", "l"), col="black", cex=1.6, lwd=3)