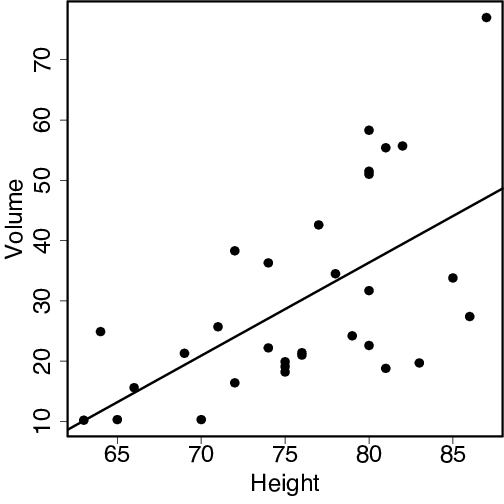
plot(trees$Height, trees$Volume,     # Make scatter plot
     xlab="Height", ylab="Volume", cex=mycex)
abline(result)                       # Add fitted line