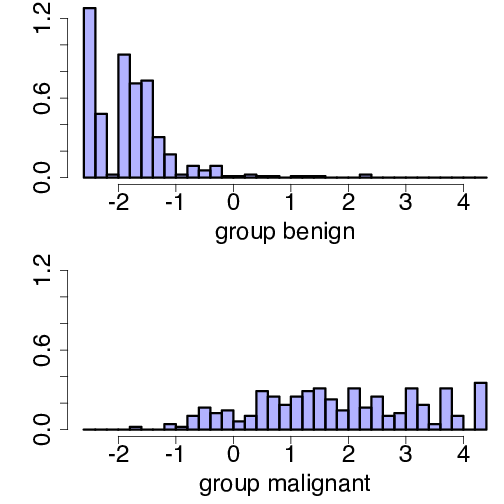
R code used to produce the graph shown below.
plot(fit, col=myblue)