layout2 <- layout(matrix(c(1, 0, 2, 3), nrow=2, byrow=TRUE),
widths=c(3, 1),
heights=c(1, 3))
# Remove some of the white space around the plots
oldpar <- par()
par(mar=c(4, 4.3, 0, 0) +.1)
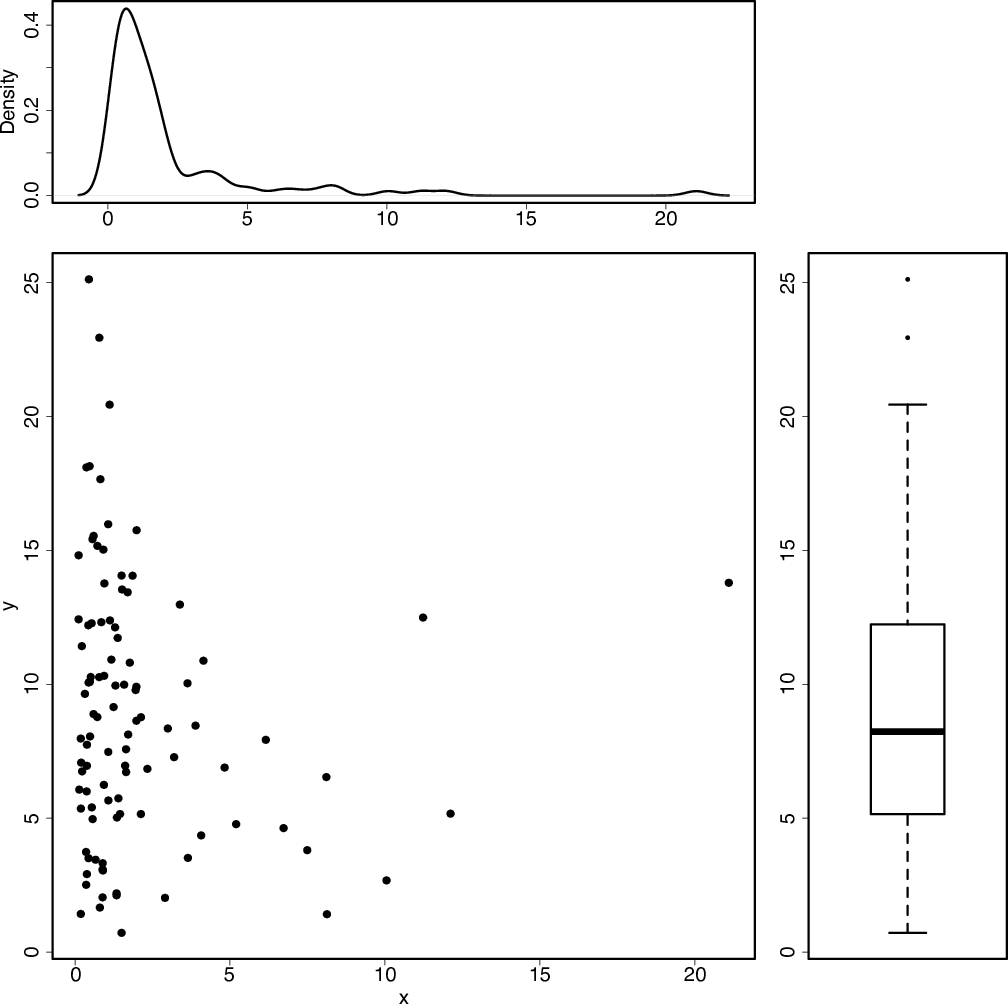
plot(density(x), main="", xlab="")
plot(x, y, cex=mycex)
boxplot(y)
par(oldpar)