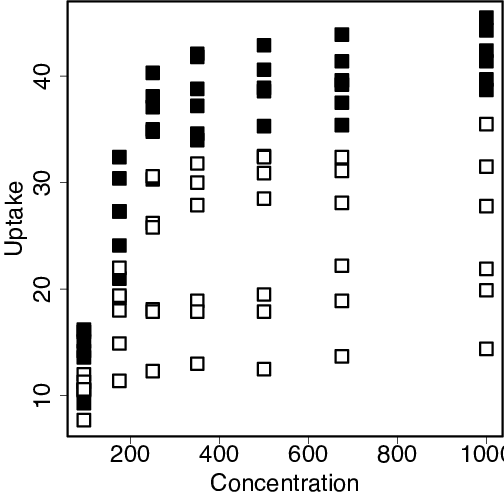
data(CO2)
plot(CO2$conc, CO2$uptake, pch=22, cex=2.6,
     bg=c("black", "white")[as.numeric(CO2$Type)],
     xlab="Concentration", ylab="Uptake")