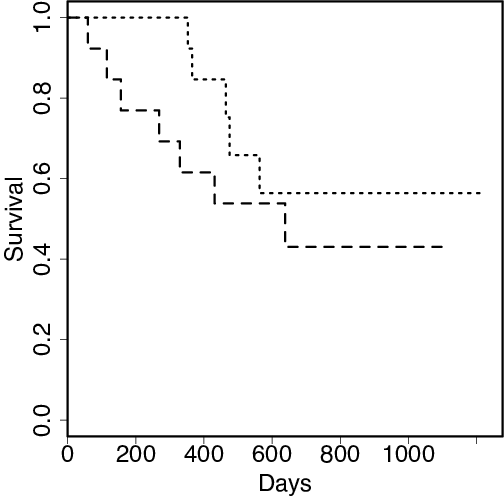
# Fit Kaplan-Meier curves for each treatment
model <- survfit(Surv(futime, fustat) ~ rx, data=ovarian)
plot(model, lty=2:3, xlab="Days", ylab="Survival", lwd=3, cex=1.6) # Plot them