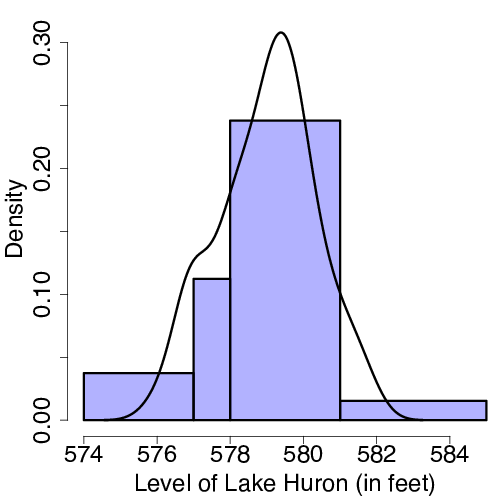
hist(LakeHuron, xlab="Level of Lake Huron (in feet)",
     freq=FALSE, breaks=c(574, 577, 578, 581, 585),
     col=myblue, main=NULL, ylim=c(0, .32))
lines(density(LakeHuron))