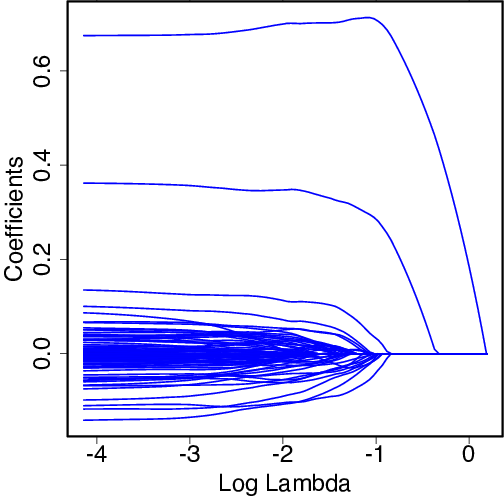
library(glmnet)
set.seed(12345)    # Set seed to keep results reproducible
x <- matrix(rnorm(100*100000), ncol=100000)
y <- rnorm(100, mean=x[,1] + .5*x[,2])
result <- glmnet(x, y)
plot(result, xvar="lambda", col="blue", lwd=2)