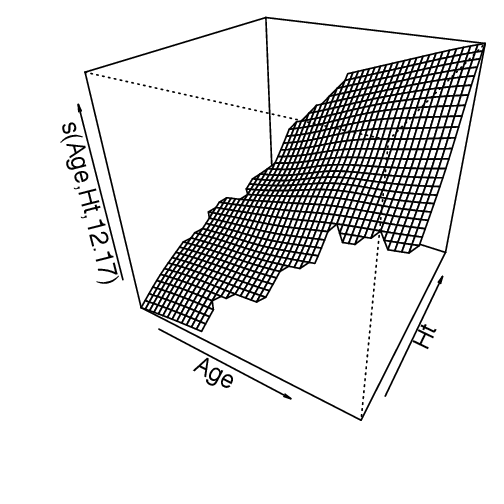
R code used to produce the graph shown below.
plot(model2, cex=mycex, lwd=2, pers=TRUE)