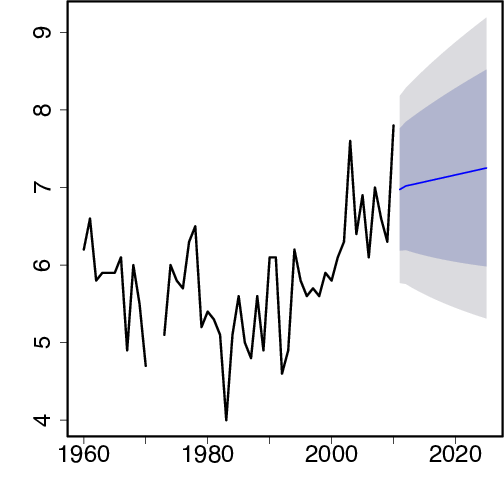
R code used to produce the graph shown below.
plot(forecast(model, h=15), main="")