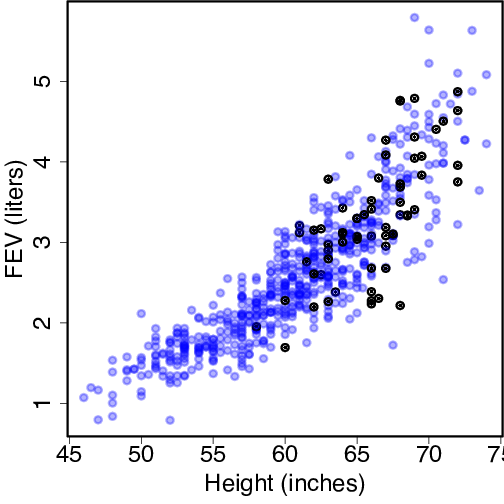
plot(FEV ~ Ht, pch=20, col=c(myblue, "Black")[Smoke],
   xlab="Height (inches)", ylab="FEV (liters)",  data=fev, cex=mycex)