nd <- data.frame(start=c(0, 50, 0), stop=c(50, 250, 300), event=1,
transplant=c(0, 1, 0), year=1, id=c(1, 1, 2))
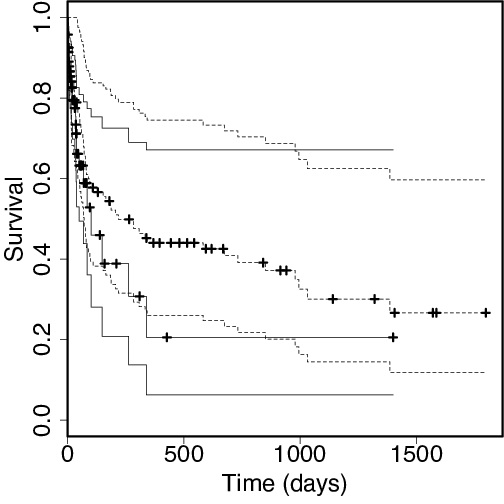
plot(survfit(model, newdata=nd, id=id),
xlab="Time since admission (days)", ylab="Survival",
col=c("black", "blue"), conf.int=TRUE, lwd=3)