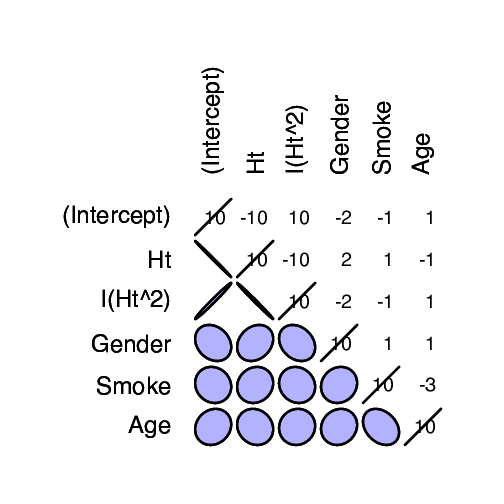
library(isdals)
data(fev)
model <- lm(FEV ~ Ht + I(Ht^2) + Gender + Smoke + Age,
            data=fev)
corr2 <- cov2cor(vcov(model))     # Correlation matrix
plotcorr(corr2,  type="lower", diag=TRUE, , col=myblue)
par(new=TRUE)                     # Keep 1st plot and add numbers
plotcorr(corr2, type="upper", diag=TRUE, numbers=TRUE, cex=1.6)