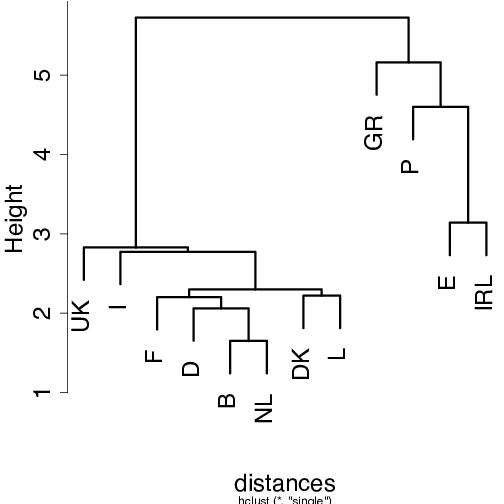
oldpar <- par()
plot(hierclust,main="", cex=mycex)
plot(hierclust.single, main="", cex=mycex)
cutree(hierclust, k=2)         # Cut tree to get 2 groups
cutree(hierclust.single, h=5)  # Cut at height 5
par(oldpar)