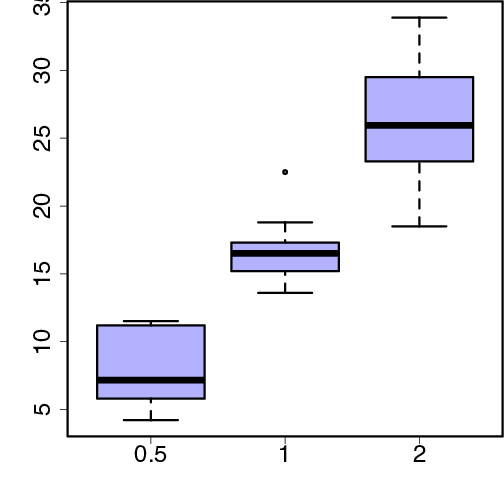
data(ToothGrowth)
teeth <- subset(ToothGrowth, supp=="VC") # Use only some data
boxplot(len ~ factor(dose), data=teeth, col=myblue)