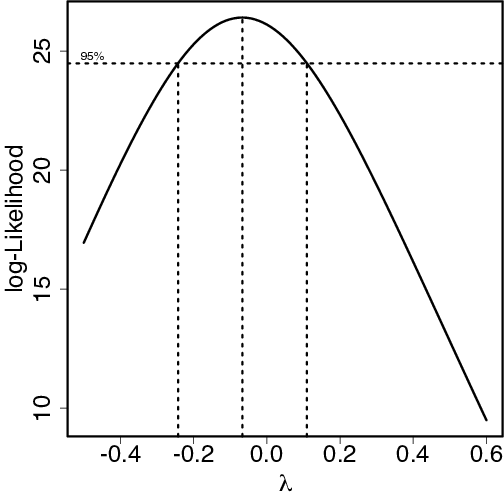
library(MASS)
data(trees)
result <- boxcox(Volume ~ log(Height) + log(Girth), data=trees,
                 lambda=seq(-0.5, 0.6, length=13))