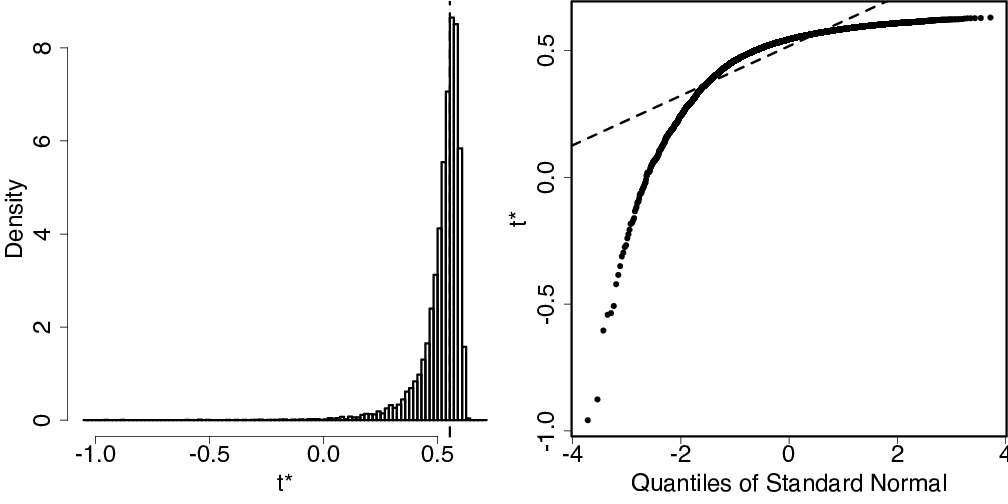
R code used to produce the graph shown below.
result <- boot(mydata, heritability, R=10000)
result
plot(result)

plotmyboot <- function (x, index = 1, t0 = NULL, t = NULL, jack = FALSE, qdist = "norm",
          nclass = NULL, df, ...)
    {
        boot.out <- x
        t.o <- t
        if (is.null(t)) {
            t <- boot.out$t[, index]
            if (is.null(t0))
                t0 <- boot.out$t0[index]
        }
        t <- t[is.finite(t)]
        if (boot:::const(t, min(1e-08, mean(t, na.rm = TRUE)/1e+06))) {
            print(paste("All values of t* are equal to ", mean(t,
                                                               na.rm = TRUE)))
            return(invisible(boot.out))
        }
        if (is.null(nclass))
            nclass <- min(max(ceiling(length(t)/25), 10), 100)
        if (!is.null(t0)) {
            rg <- range(t)
            if (t0 < rg[1L])
                rg[1L] <- t0
            else if (t0 > rg[2L])
                rg[2L] <- t0
            rg <- rg + 0.05 * c(-1, 1) * diff(rg)
            lc <- diff(rg)/(nclass - 2)
            n1 <- ceiling((t0 - rg[1L])/lc)
            n2 <- ceiling((rg[2L] - t0)/lc)
            bks <- t0 + (-n1:n2) * lc
        }
        R <- boot.out$R
        if (qdist == "chisq") {
            qq <- qchisq((seq_len(R))/(R + 1), df = df)
            qlab <- paste("Quantiles of Chi-squared(", df, ")", sep = "")
        }
        else {
            if (qdist != "norm")
                warning(gettextf("%s distribution not supported: using normal instead",
                                 sQuote(qdist)), domain = NA)
            qq <- qnorm((seq_len(R))/(R + 1))
            qlab <- "Quantiles of Standard Normal"
        }
        if (jack) {
            layout(mat = matrix(c(1, 2, 3, 3), 2L, 2L, byrow = TRUE))
            if (is.null(t0))
                hist(t, nclass = nclass, probability = TRUE, xlab = "t*", main="")
            else hist(t, breaks = bks, probability = TRUE, xlab = "t*", main="")
            if (!is.null(t0))
                abline(v = t0, lty = 2)
            qqplot(qq, t, xlab = qlab, ylab = "t*")
            if (qdist == "norm")
                abline(mean(t), sqrt(var(t)), lty = 2)
            else abline(0, 1, lty = 2)
            jack.after.boot(boot.out, index = index, t = t.o, ...)
        }
        else {
            par(mfrow = c(1, 2))
            if (is.null(t0))
                hist(t, nclass = nclass, probability = TRUE, xlab = "t*", main="")
            else hist(t, breaks = bks, probability = TRUE, xlab = "t*", main="")
            if (!is.null(t0))
                abline(v = t0, lty = 2)
            qqplot(qq, t, xlab = qlab, ylab = "t*")
            if (qdist == "norm")
                abline(mean(t), sqrt(var(t)), lty = 2)
            else abline(0, 1, lty = 2)
        }
        par(mfrow = c(1, 1))
        invisible(boot.out)
    }
   plotmyboot(result, main="asdasd")