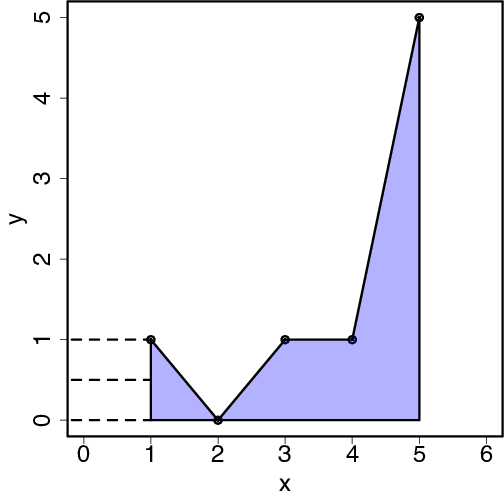
plot(x, y, cex=mycex, xlim=c(0,6))
polygon(c(x[1], x, x[length(x)]), c(0, y, 0), col=bluebackground)
lines(c( -2,  1), c(0,0), lty=2)
lines(c( -2, 1), c(.5,.5), lty=2)
lines(c( -2, 1), c(1,1), lty=2)