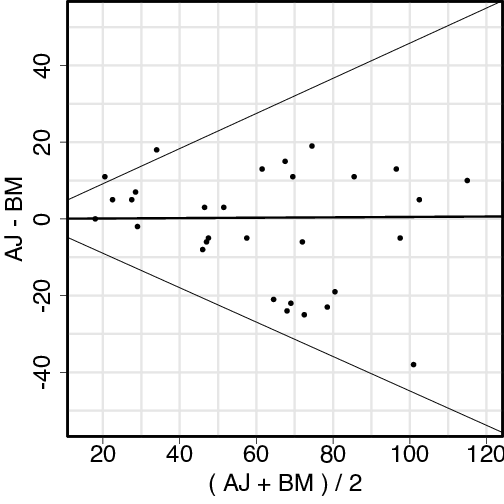
R code used to produce the graph shown below.
plot(mydata, cex=1.6)
plot(result, wh.comp=c(1,2), points=TRUE, pl.type="BA")