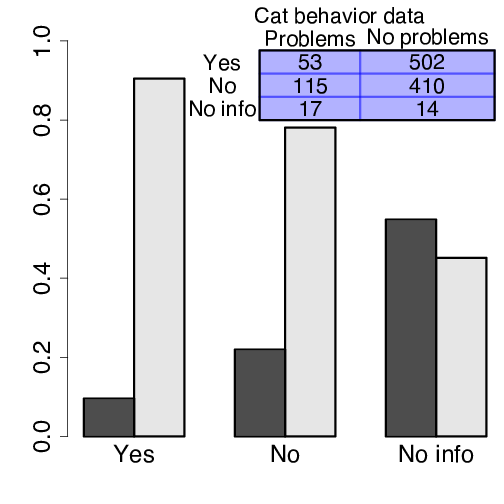
cattable <-  cats / apply(cats, 1, sum)
barplot(t(cattable), beside=TRUE, ylim=c(0,1.1))
addtable2plot(3.0, .8, cats, display.rownames=TRUE, bty="o",
              bg=myblue, title="Cat behavior data", cex=1.8)